Visible to Intel only — GUID: txk1517866523631
Ixiasoft
1. Introduction to Standard Edition Best Practices Guide
2. Reviewing Your Kernel's report.html File
3. OpenCL Kernel Design Best Practices
4. Profiling Your Kernel to Identify Performance Bottlenecks
5. Strategies for Improving Single Work-Item Kernel Performance
6. Strategies for Improving NDRange Kernel Data Processing Efficiency
7. Strategies for Improving Memory Access Efficiency
8. Strategies for Optimizing FPGA Area Usage
A. Additional Information
2.1. High Level Design Report Layout
2.2. Reviewing the Report Summary
2.3. Reviewing Loop Information
2.4. Reviewing Area Information
2.5. Verifying Information on Memory Replication and Stalls
2.6. Optimizing an OpenCL Design Example Based on Information in the HTML Report
2.7. HTML Report: Area Report Messages
2.8. HTML Report: Kernel Design Concepts
3.1. Transferring Data Via Channels or OpenCL Pipes
3.2. Unrolling Loops
3.3. Optimizing Floating-Point Operations
3.4. Allocating Aligned Memory
3.5. Aligning a Struct with or without Padding
3.6. Maintaining Similar Structures for Vector Type Elements
3.7. Avoiding Pointer Aliasing
3.8. Avoid Expensive Functions
3.9. Avoiding Work-Item ID-Dependent Backward Branching
4.3.4.1. High Stall Percentage
4.3.4.2. Low Occupancy Percentage
4.3.4.3. Low Bandwidth Efficiency
4.3.4.4. High Stall and High Occupancy Percentages
4.3.4.5. No Stalls, Low Occupancy Percentage, and Low Bandwidth Efficiency
4.3.4.6. No Stalls, High Occupancy Percentage, and Low Bandwidth Efficiency
4.3.4.7. Stalling Channels
4.3.4.8. High Stall and Low Occupancy Percentages
7.1. General Guidelines on Optimizing Memory Accesses
7.2. Optimize Global Memory Accesses
7.3. Performing Kernel Computations Using Constant, Local or Private Memory
7.4. Improving Kernel Performance by Banking the Local Memory
7.5. Optimizing Accesses to Local Memory by Controlling the Memory Replication Factor
7.6. Minimizing the Memory Dependencies for Loop Pipelining
Visible to Intel only — GUID: txk1517866523631
Ixiasoft
4.2.3. Autorun Captures Tab
To view the autorun statistical data, use the similar to how you view an enqueued kernel's data. Both autorun and enqueued kernel statistical data are stored in a single profile.mon file.
The autorun profile data is displayed similar to the enqueued profile data. However, autorun kernels does not have a runtime representation in the Execution Tab since autorun kernels run continuously.
Attention: If you profile autorun kernels multiple times, data displayed in the is an average total of all the profile instances.
If you profile autorun kernels at least once, the Autorun Captures tab appears in the GUI. This tab displays a table of all autorun profile captures organized by device and kernel. To view the profile data of an autorun kernel for a specific capture, select the associated button and a new profiler window opens to display data only from that autorun capture (instead of the overall average).
In the following figure, there are four autorun capture instances. If you want to view the autorun profile data from the capture done at 0.03ms for the streamer autorun kernel on device 0, then select the 0.03ms button in the Device 0 streamer row.
Figure 68. Autorun Captures Tab
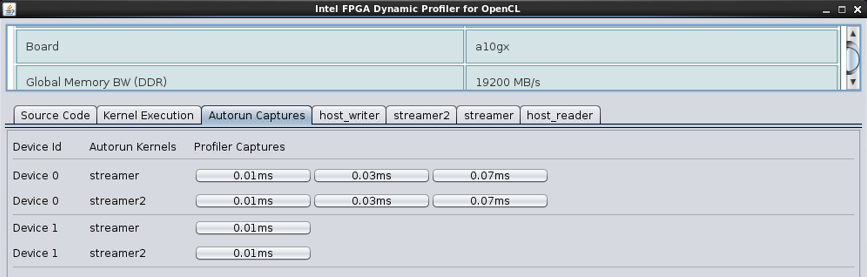
The Profiler Captures buttons are labelled with time during which the capture was started. This time is relative to the start of the host program.
Attention: Capture time does not correlate with the timeline found in the Kernel Execution tab, as this timeline is relative to the start of the first enqueued kernel and not the host program.