Visible to Intel only — GUID: tbu1568316388771
Ixiasoft
Product Discontinuance Notification
1. Introduction to Intel® FPGA SDK for OpenCL™ Pro Edition Best Practices Guide
2. Reviewing Your Kernel's report.html File
3. OpenCL Kernel Design Concepts
4. OpenCL Kernel Design Best Practices
5. Profiling Your Kernel to Identify Performance Bottlenecks
6. Strategies for Improving Single Work-Item Kernel Performance
7. Strategies for Improving NDRange Kernel Data Processing Efficiency
8. Strategies for Improving Memory Access Efficiency
9. Strategies for Optimizing FPGA Area Usage
10. Strategies for Optimizing Intel® Stratix® 10 OpenCL Designs
11. Strategies for Improving Performance in Your Host Application
12. Intel® FPGA SDK for OpenCL™ Pro Edition Best Practices Guide Archives
A. Document Revision History for the Intel® FPGA SDK for OpenCL™ Pro Edition Best Practices Guide
2.1. High-Level Design Report Layout
2.2. Reviewing the Summary Report
2.3. Viewing Throughput Bottlenecks in the Design
2.4. Using Views
2.5. Analyzing Throughput
2.6. Reviewing Area Information
2.7. Optimizing an OpenCL Design Example Based on Information in the HTML Report
2.8. Accessing HLD FPGA Reports in JSON Format
4.1. Transferring Data Via Intel® FPGA SDK for OpenCL™ Channels or OpenCL Pipes
4.2. Unrolling Loops
4.3. Optimizing Floating-Point Operations
4.4. Allocating Aligned Memory
4.5. Aligning a Struct with or without Padding
4.6. Maintaining Similar Structures for Vector Type Elements
4.7. Avoiding Pointer Aliasing
4.8. Avoid Expensive Functions
4.9. Avoiding Work-Item ID-Dependent Backward Branching
5.1. Best Practices for Profiling Your Kernel
5.2. Instrumenting the Kernel Pipeline with Performance Counters (-profile)
5.3. Obtaining Profiling Data During Runtime
5.4. Reducing Area Resource Use While Profiling
5.5. Temporal Performance Collection
5.6. Performance Data Types
5.7. Interpreting the Profiling Information
5.8. Profiler Analyses of Example OpenCL Design Scenarios
5.9. Intel® FPGA Dynamic Profiler for OpenCL™ Limitations
8.1. General Guidelines on Optimizing Memory Accesses
8.2. Optimize Global Memory Accesses
8.3. Performing Kernel Computations Using Constant, Local or Private Memory
8.4. Improving Kernel Performance by Banking the Local Memory
8.5. Optimizing Accesses to Local Memory by Controlling the Memory Replication Factor
8.6. Minimizing the Memory Dependencies for Loop Pipelining
8.7. Static Memory Coalescing
Visible to Intel only — GUID: tbu1568316388771
Ixiasoft
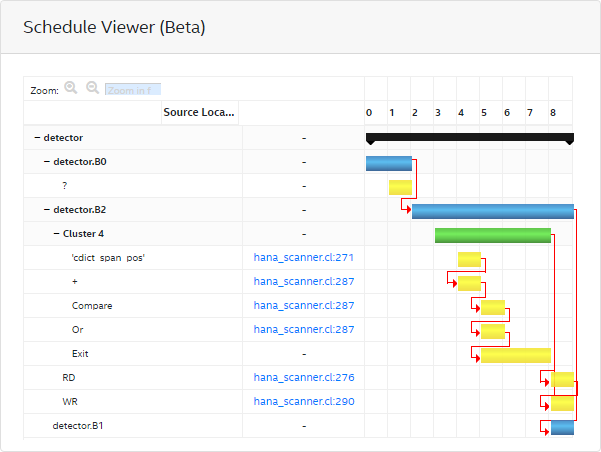
2.4.3. Features of the Schedule Viewer
The Schedule Viewer displays a static view of the scheduled cycle and latency of a clustered group of instructions in your design. Use this report to view loop bottlenecks such as fMAX/II bottlenecks, memory dependency, and occupancy limiter.
In the Schedule Viewer:
- Columns depict the clock cycles.
- Rows display a list of kernels, blocks, clusters, and instructions ranked by the order of execution.
- The red arrows are dependency lines for each block, cluster, or instruction. The arrows show how each block, cluster, or instruction is dependent on other blocks, clusters, or instructions. Hovering over a node (bar) highlights its outgoing dependency lines.
- Each row represents a node and its start and end cycle.
- The bars are color-coded. Black indicates a kernel, blue indicates a block, green indicates a cluster, and yellow indicates an instruction.
Figure 23. Schedule Viewer